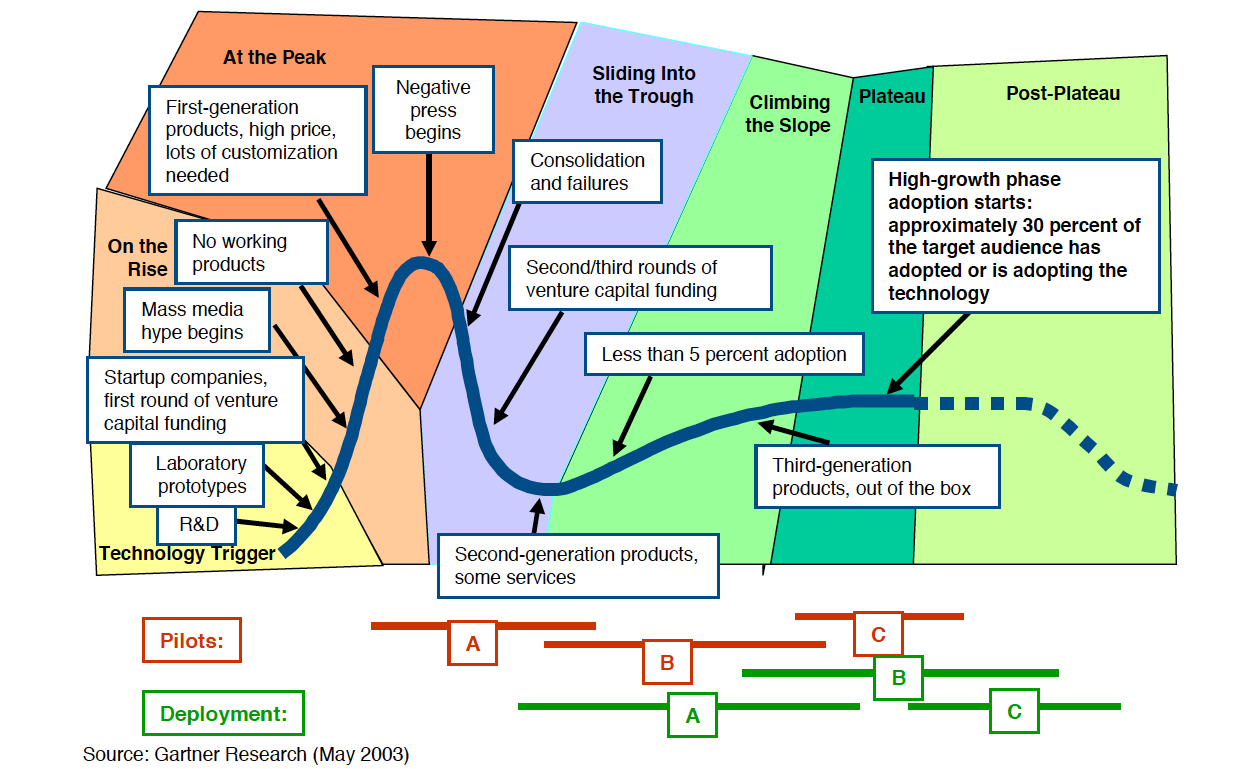
Gartner Hype Curve in images

This curve represents how technologies move through their hype cycle. Typically most of the tech go through each stage.

Abstract:
480px-Gartner_Hype_Cycle.svg.png

Details:
Gartner-Hype-Cycle-Phases.png

Examples (might not be accurate nor timely):
2012Emerging-Technologies-Graphic4.gif

 
7
Kudos
 
7
Kudos

Now read this

Multi-feature staging environment(s)

It is hard to work on several versions of a web app and demo them to other people on the Internet (or in an organization). In other words: how do you elegantly deploy all of your git branches and make them accessible on the Internet? The... Continue →